

Rainfall calculator
Below you can find a little program to calculate the amount of rain water (precipitation) that will fall on a certain surface (your roof or premises). The amount is indicated in m3 (=1000 liters, for US/UK units click here). Also you can add the cost of mains or tap water per M3 to evaluate the cost savings per year if this rainwater is collected and used instead of drinking water.
Rainfall varies by location, season and observation period. Use local rainfall records for the period being assessed rather than treating a historical annual average as a prediction.
Find more on http://www.onlineweather.com/v4/data/weatherfacts/rainfall.html.
On islands it generally rains more than on continental lands. It rains less in the middle east. In the tropical forests it rains a lot. It rains the least in The Western Sahara. Generally speaking it rains the most in South America, followed by East Asia, North America, West Asia, Africa and Europe. Here is a small table of yearly precipitation of some countries:
|

Go with your mouse over the image!! |
If your country is not mentioned above, you can find it in http://www.cru.uea.ac.uk/~timm/climate/cty_new/obs.wei.clim.pre.agg.
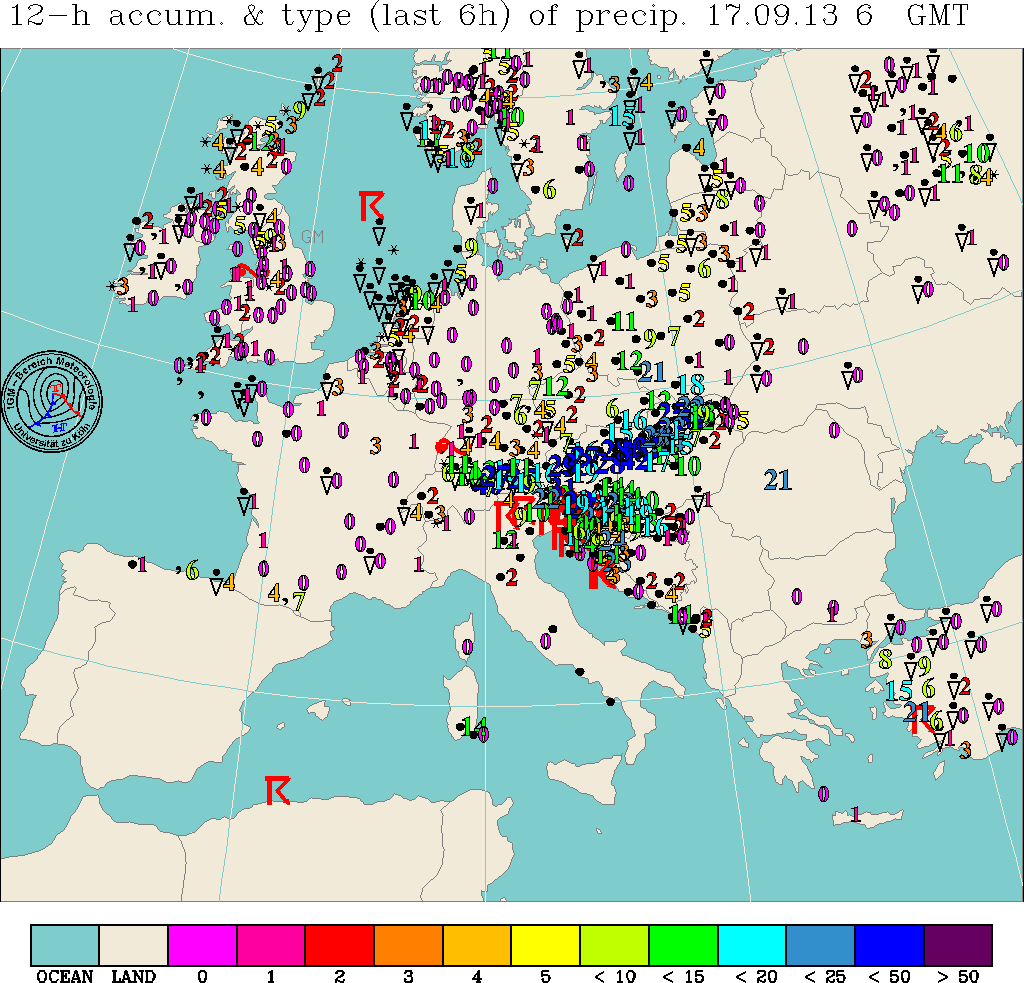
You can find the rainfall in Europe at http://www.uni-koeln.de/math-nat-fak/geomet/meteo/winfos/precieuropa.gif. This gives the rainfall of the last six hours.
For the Dutch, here are some specifications:
| Month | Average Temp. | Maximum Temp. | Minimum Temp. | Precipitation | Precipitation- time |
|---|---|---|---|---|---|
| January | 2,8°C | 5,2°C | 0,0°C | 67 mm | 68 hour |
| February | 3,0°C | 6,1°C | -0,1°C | 48 mm | 49 hour |
| March | 5,8°C | 9,6°C | 2,0°C | 65 mm | 67 hour |
| April | 8,3°C | 12,9°C | 3,5°C | 45 mm | 44 hour |
| May | 12,7°C | 17,6°C | 7,5°C | 62 mm | 40 hour |
| June | 15,2°C | 19,8°C | 10,2°C | 72 mm | 45 hour |
| July | 17,4°C | 22,1°C | 12,5°C | 70 mm | 37 hour |
| Augustus | 17,2°C | 22,3°C | 12,0°C | 58 mm | 31 hour |
| September | 14,2°C | 18,7°C | 9,6°C | 72 mm | 48 hour |
| October | 10,3°C | 14,2°C | 6,5°C | 77 mm | 57 hour |
| November | 6,2°C | 9,1°C | 3,2°C | 81 mm | 70 hour |
| December | 4,0°C | 6,4°C | 1,3°C | 77 mm | 68 hour |
The average weather in De Bilt per month over 1971-2000
Source: KNMI
Find more about water recycling at Lenntech Water Recycling.
Lenntech BV is not responsible for programming or calculation errors on this sheet. Feel free to contact us for any feedback.